
IntelliJ IDEA
Level Up
Your Spring Development
Use IntelliJ IDEA – the leading IDE for professional development in Java and Kotlin
Get started with ease

Create a Spring Boot project in seconds
Create your Spring Boot project in a few clicks, set up the necessary dependencies, and start coding right away.
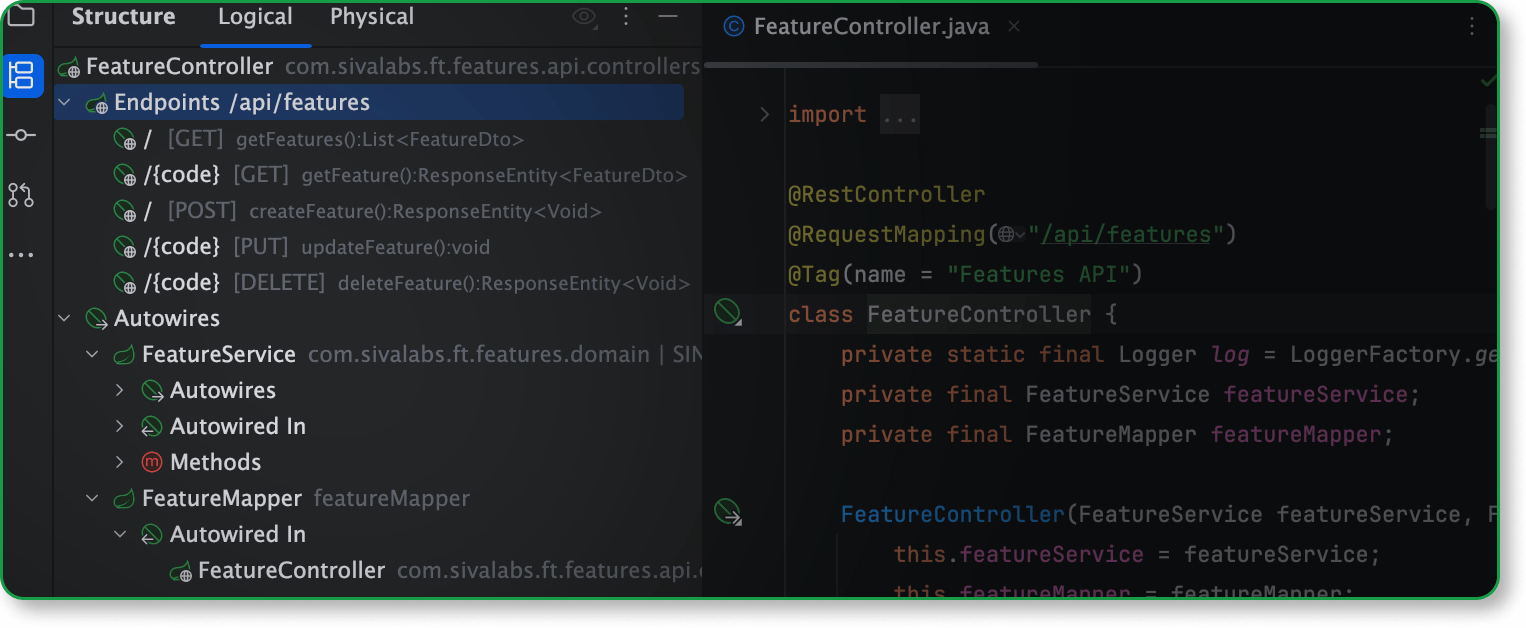
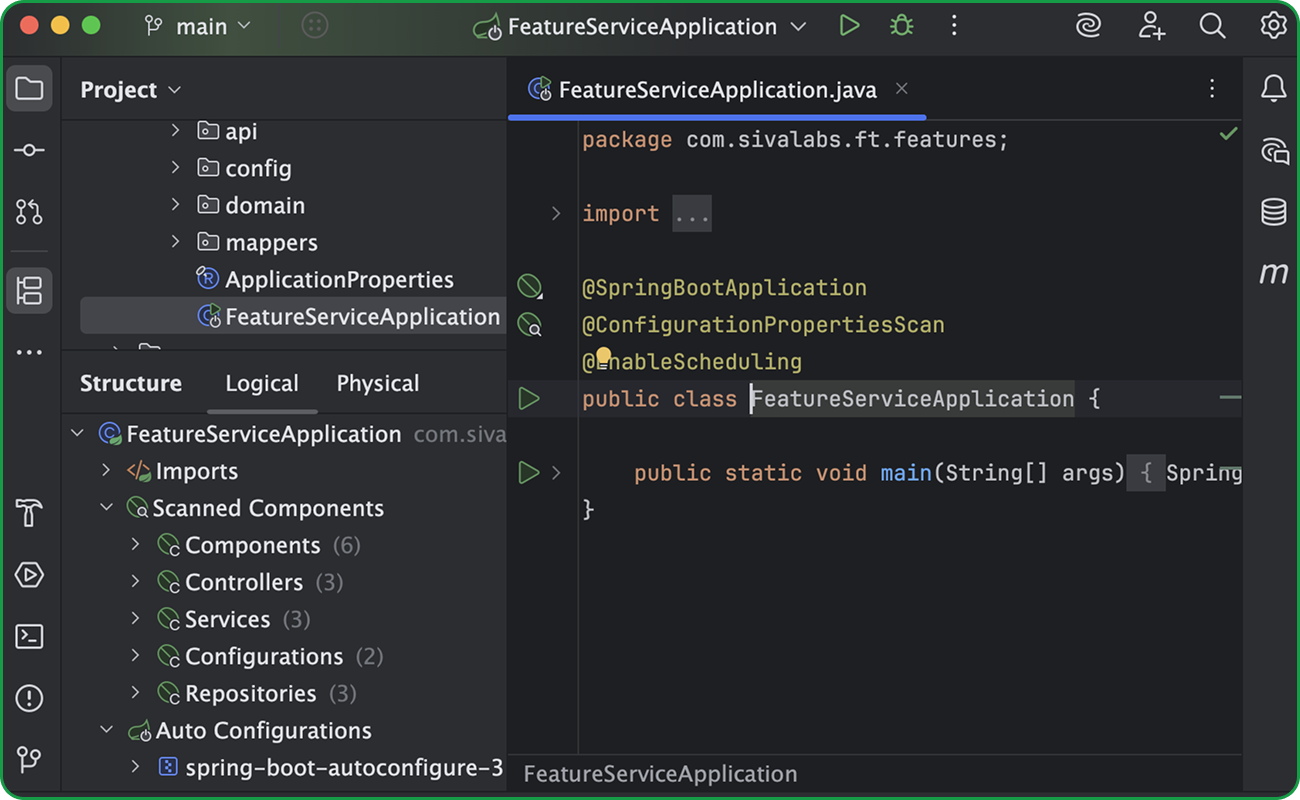
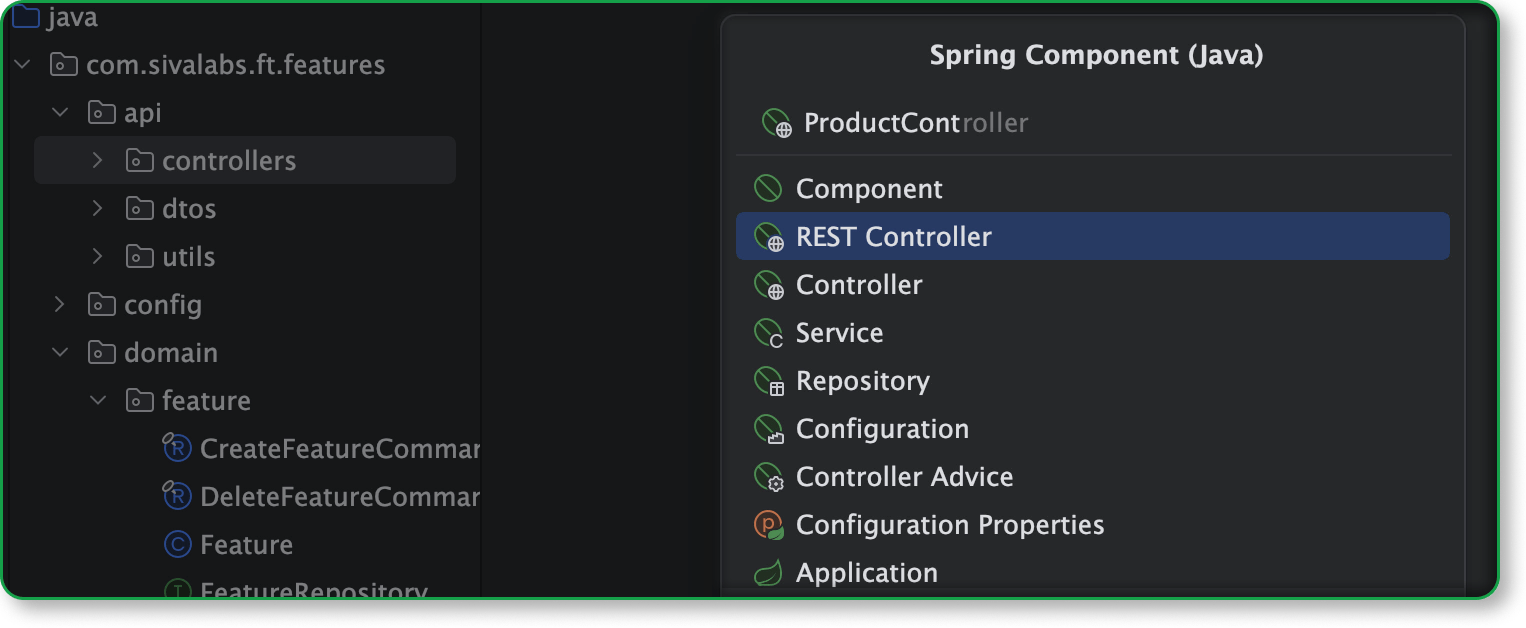
Understand the component connections – instantly
Explore your app with a Spring-aware Logical Structure view. Easily follow autowiring paths between beans, spot key relationships between them at a glance, and explore new codebases with ease.
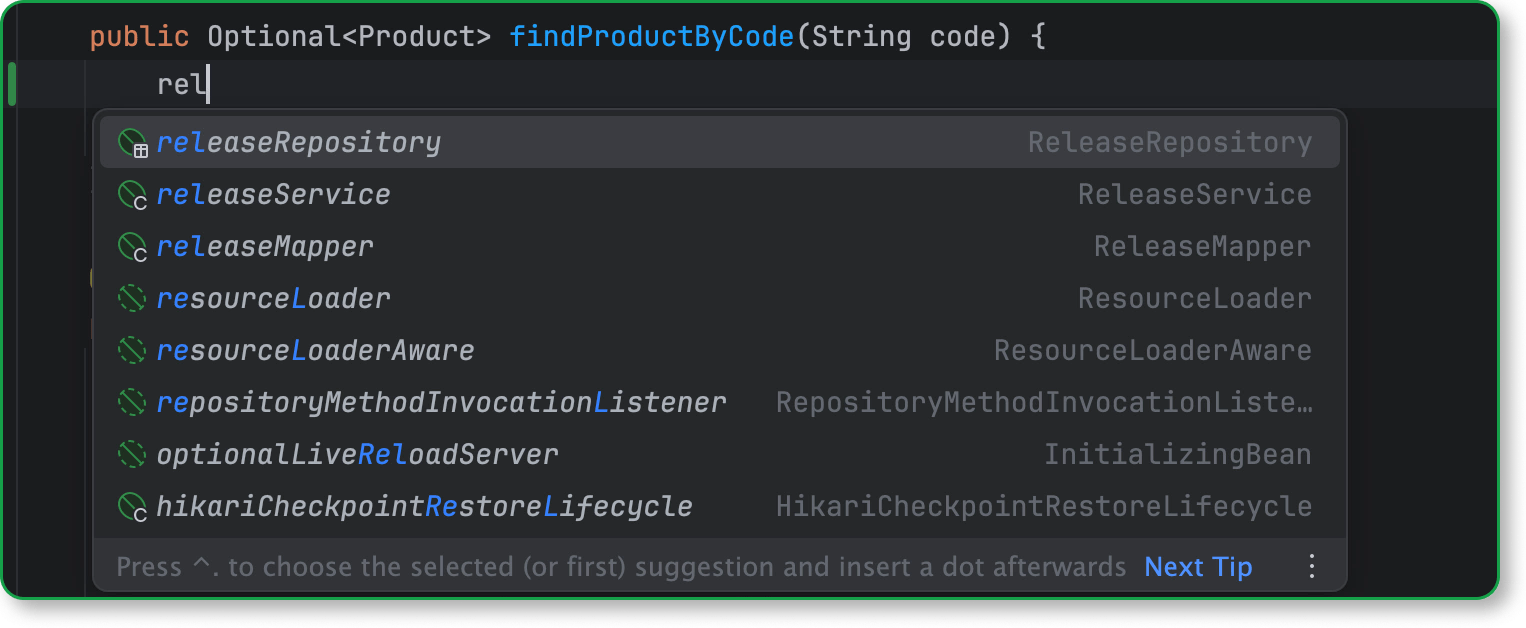
Smarter code completion for Spring applications
Get unparalleled Spring‑aware completion for both Java and Kotlin.
The IDE automatically suggests beans as you type and generates the autowiring code for you, helping you focus on building features instead of boilerplate.

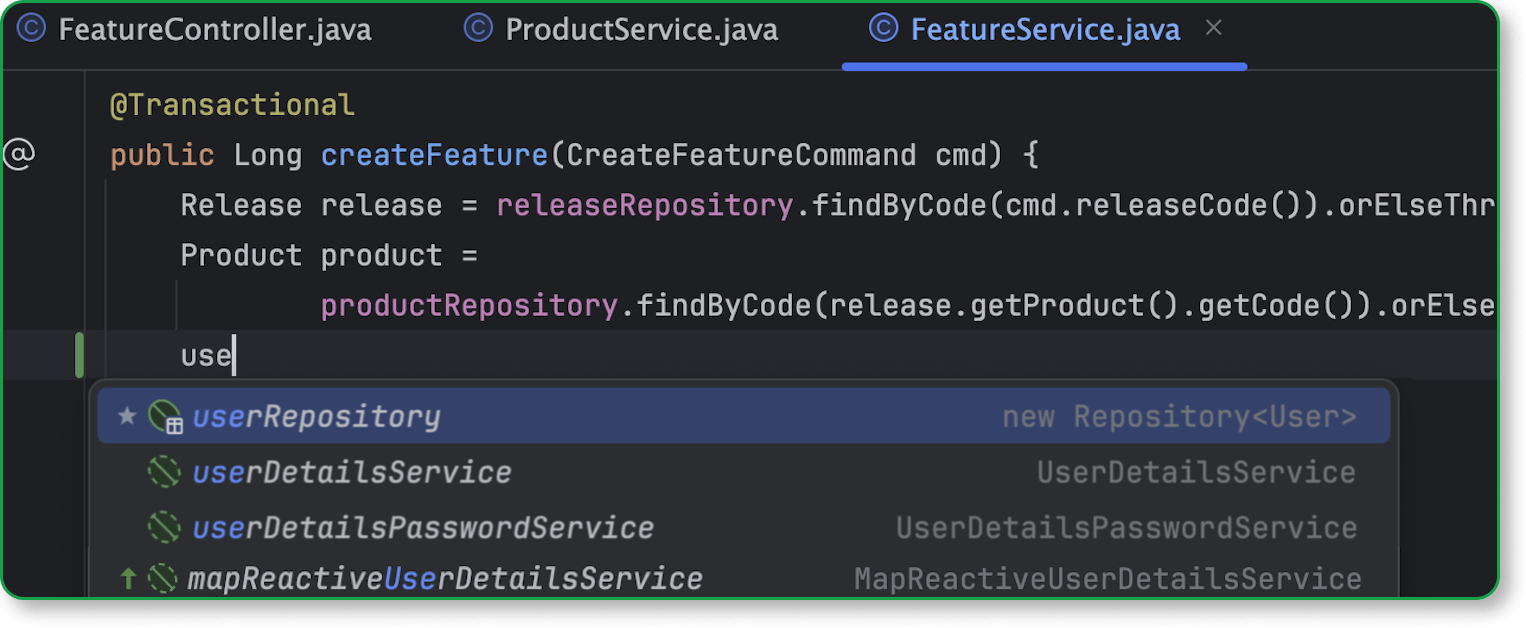
Create repositories on the go
Create a repository for Spring Data JPA and JDBC simply by typing a name for it. IntelliJ IDEA will take care of the rest, like generating the code and autowiring the repository. You can also add query methods right in the editor, so there’s no more switching between files and losing focus.
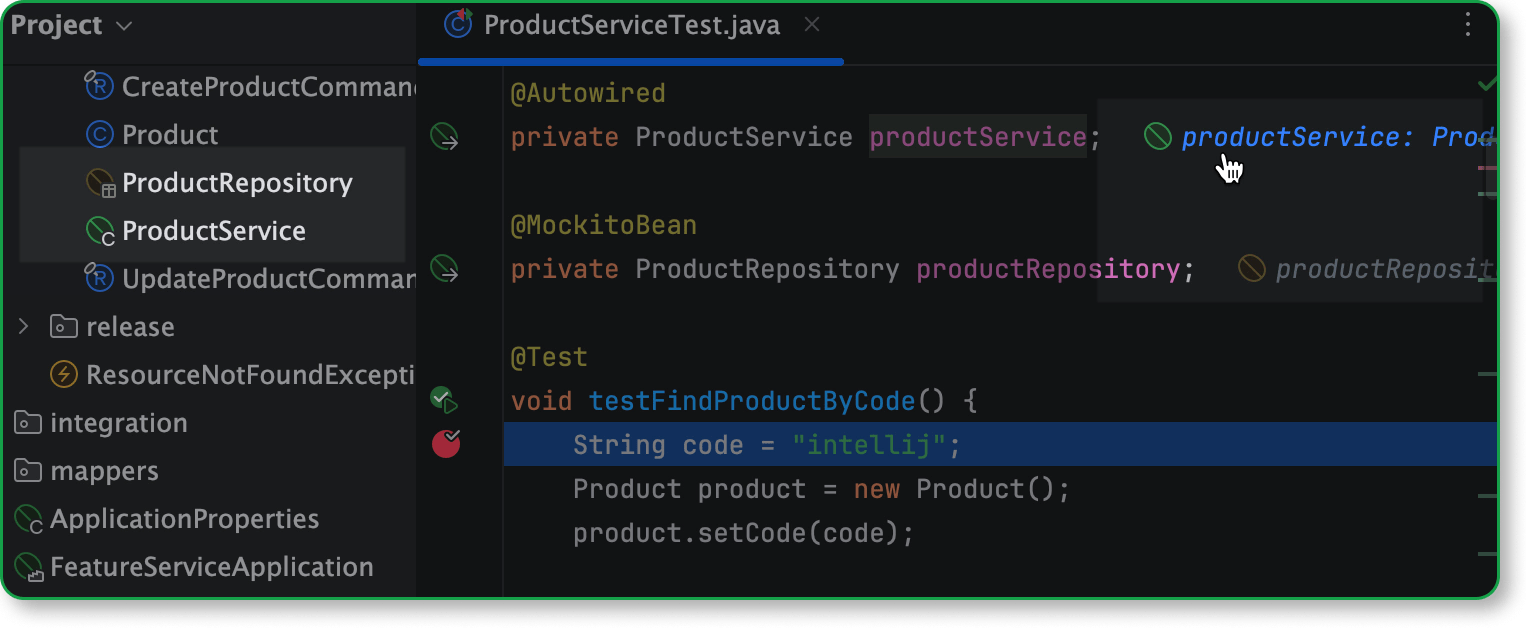
Get instant visibility into beans while debugging
View all Spring-managed beans directly in the Project view while debugging. Grayed-out entries indicate uninstantiated beans, while orange ones highlight mocked beans (via Mockito), including those with properties loaded from config files.
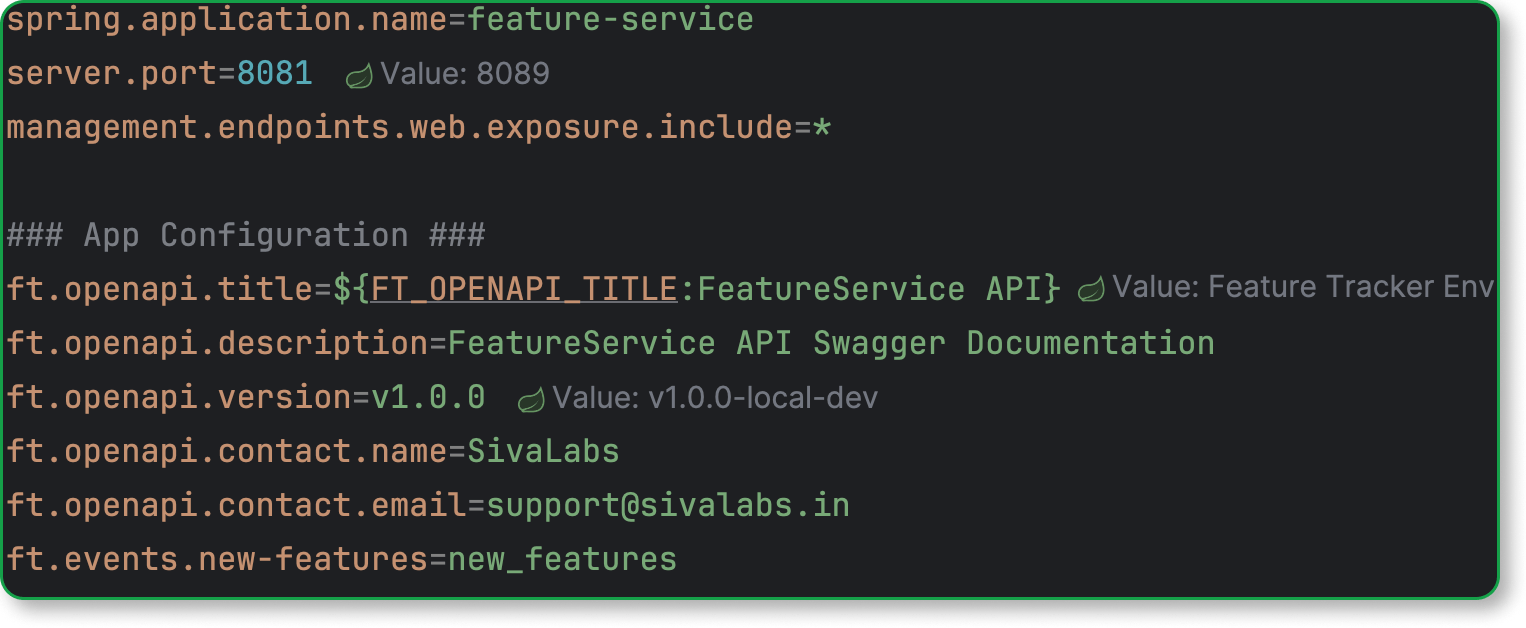
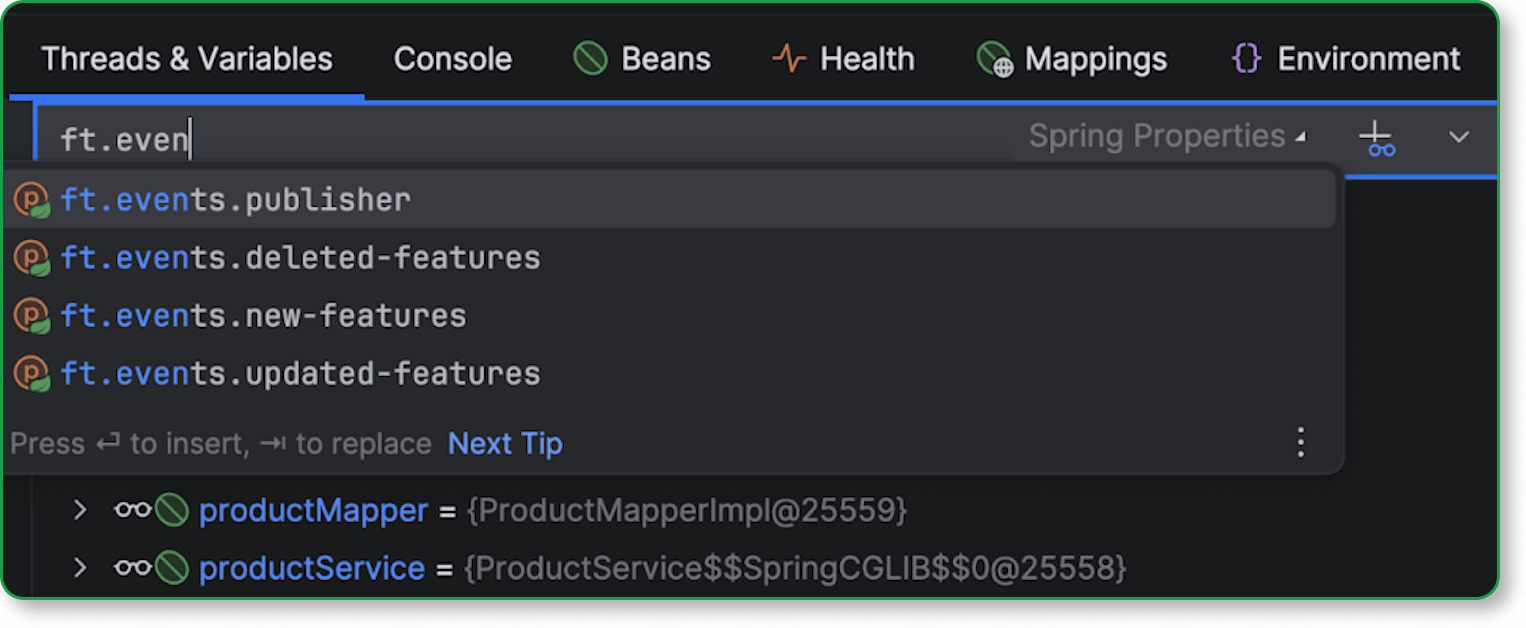
View effective property values directly in config files
See the active runtime value right in .properties and .yaml Spring configuration files, highlighting overridden values and their source locations. Click on the inlay value to jump to its definition in the code. This helps avoid misconfigurations and save time tracing where a setting originates.
Invoke any bean method
With the debugger's expression evaluator in IntelliJ IDEA, you can call any method from any Spring bean in the current context. Trigger scheduled methods, fire async events, or hit external APIs – it's like having a REPL for your Spring app, right inside the debugger.
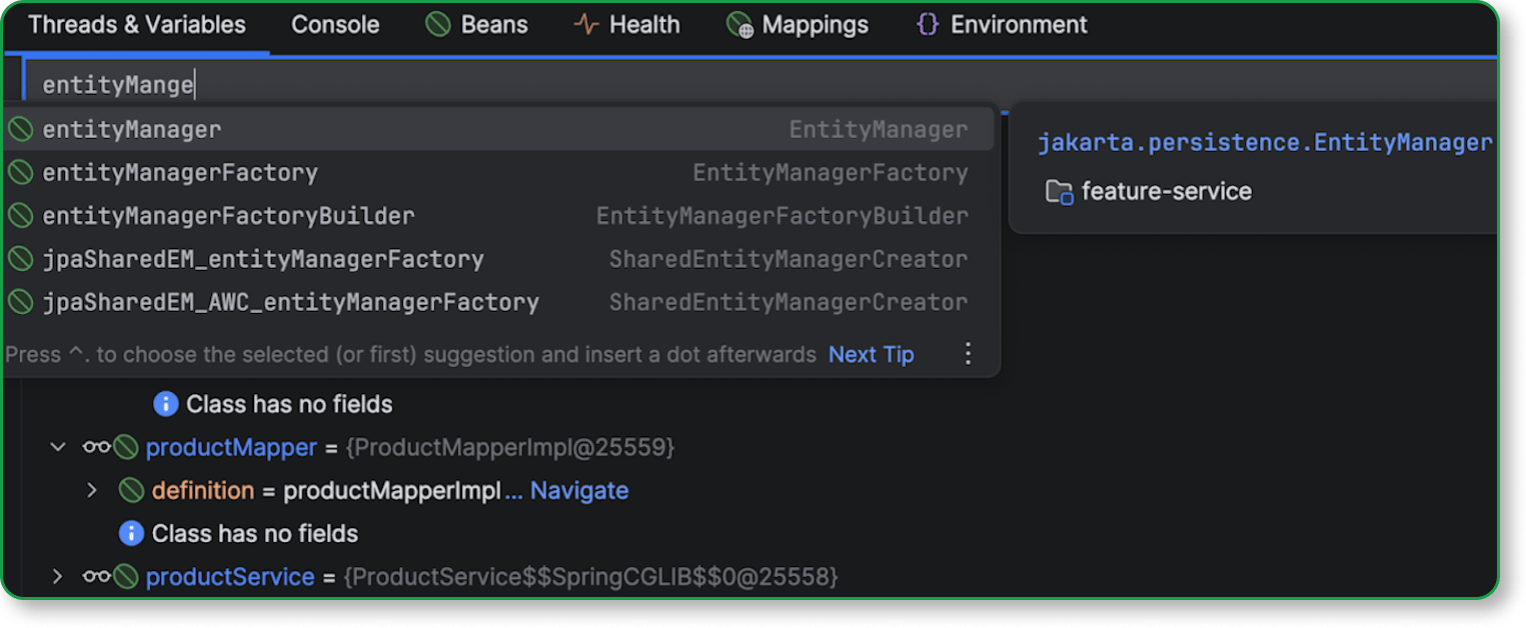
Easily evaluate property values
The Spring debugger's expression evaluator also lets you evaluate property values. Inspect effective property values, observe value sources, and follow the value assignment stack trace to understand the application configuration – all in one place.
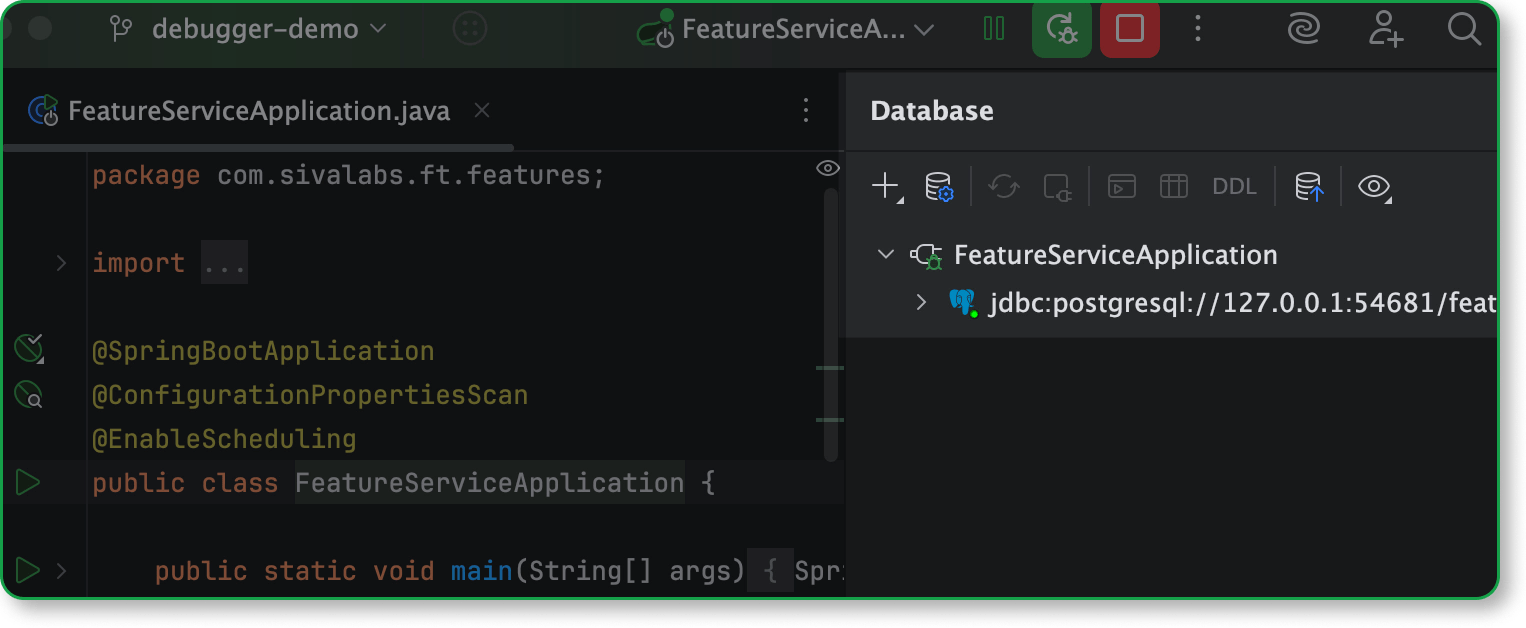
See active database connections instantly
No manual setup is needed – IntelliJ IDEA detects and shows active data source connections right in the Database tool window as soon as your Spring app starts running.
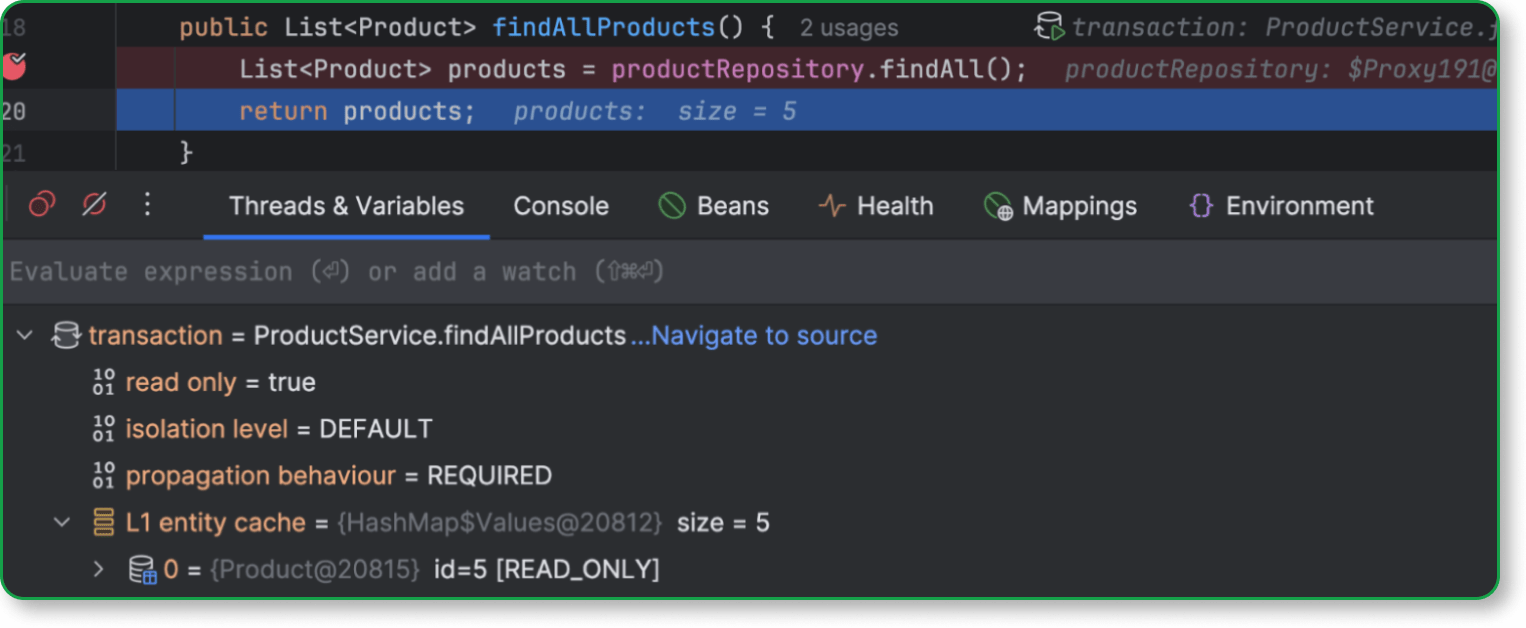
Track database transactions with ease
IntelliJ IDEA shows active transactions directly in your code and the Debugger tool window, including isolation levels and propagation.

Use gutter icons to jump straight to the relevant application contexts, autowired bean declarations, or between event publishers and their listeners.

Easily navigate between client and service
Navigate from client to service simply by clicking on the corresponding URL in your projects with Spring MVC, Spring WebFlux, and Spring Feign.
Get IntelliJ IDEA
Take your professional Java and Kotlin development experience to the next level!
Spring framework tutorials

Bootiful IntelliJ IDEA by Josh Long and Aleksey Stukalov
Join Spring Developer Advocate, Josh Long, and IntelliJ IDEA engineer extraordinaire, Aleksey Stukalov, to look at how IntelliJ IDEA and Spring Boot work in concert to help you get to production faster than ever!
Creating a Spring Boot "Hello World" Application
In this screencast, we’re going to create a simple Spring Boot Hello World application which will display some text locally in our browser.