Profile Java applications
with ease
With IntelliJ IDEA – the IDE for Professional Development in Java and Kotlin
Free 30-day trial for IntelliJ IDEA Ultimate

Monitor and analyze your application’s performance right in the IDE

Fast start
To start profiling in IntelliJ IDEA, click on three dots in the upper-right corner of the IDE or on a "Play" gutter icon next to a code line and select "Profile with IntelliJ Profiler".

Under the hood
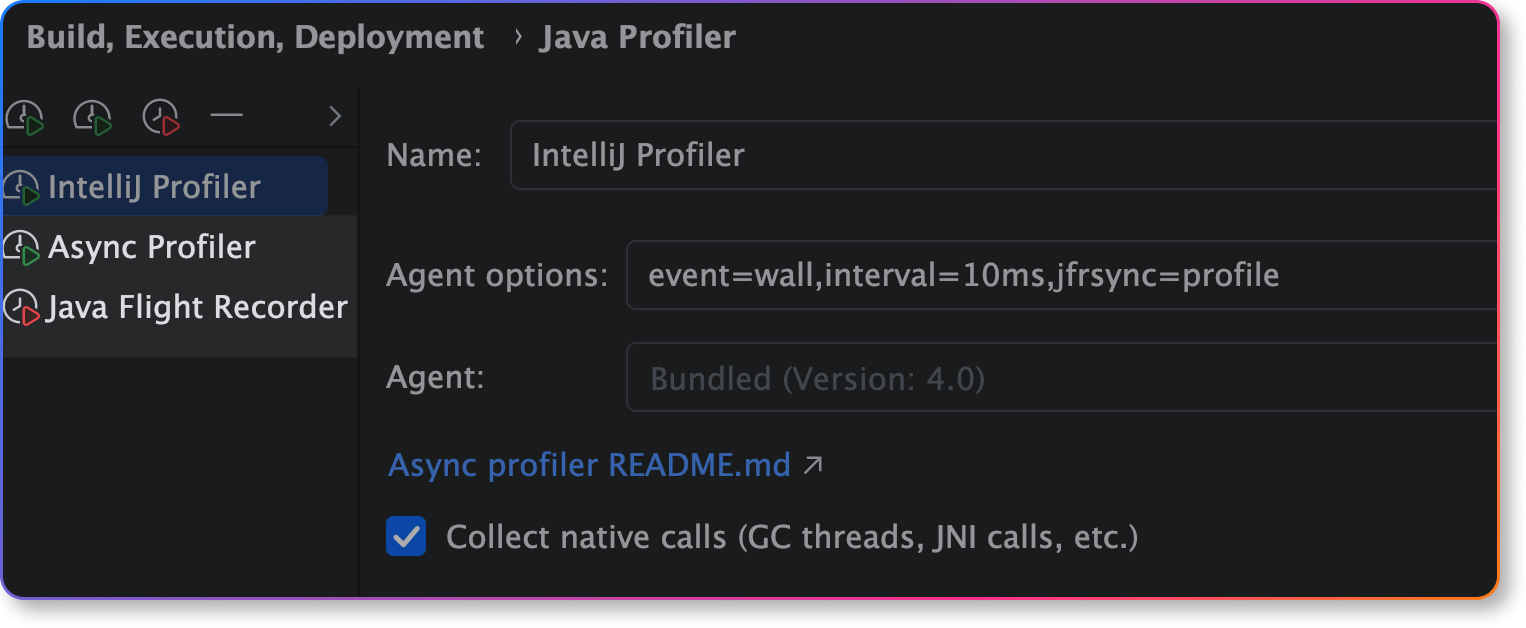
IntelliJ Profiler combines Async Profiler for precise CPU sampling with Java Flight Recorder (JFR) for rich JVM event data, running both in parallel to give you the most complete picture of your application’s performance.

In-editor performance hints
The IntelliJ Profiler has in-editor performance hints, which enhance your profiling experience by providing easy-to-interpret color-coded annotations right in the gutter.

CPU and memory live charts
IntelliJ IDEA provides a way to monitor live performance statistics for a running process. As opposed to viewing static figures, live data can help you to visualize resource consumption, identify resource-related bottlenecks, and understand how certain events affect the program performance.

Profiler tool window
Profiler tool window features different ways to display the collected data. You can choose which one works for you – flame graph, call tree, method list, timeline, or events.
Read, analyze, and navigate profiler snapshots

Flame graph
This view helps you visualize the call stack for a selected thread and see how it changes over time. The wider a stack frame is, the longer the method takes to execute. The colored blocks display native, library, and user code.

Call tree
This view shows the percentage of the CPU time used by the methods, the method execution path in your application, and the total sample count. Call tree is useful for a quick overview of application activity and detection of critical execution paths.

Method list
This view shows a list of the methods executed while you were profiling your data. All of them are sorted by cumulative sample time. Each selected method has several views that show you either the method’s callers or callees.

Timeline
This is a visual representation of threads activity over time. It is helpful for detecting unusual GC activity, multithreading issues such as livelocks, and so on.
Get IntelliJ IDEA
Take your professional Java and Kotlin development experience to the next level!
Free 30-day trial

