
Datalore

“Datalore allows us to do data storytelling very well, since we have one place where we pull the data, do complex manipulations with Python, create visualizations, and export the results into a format which is friendly for business consumers.”
Turn Jupyter Notebooks into Dashboards with a few clicks
With Datalore, you can impress your stakeholders with clean, interactive dashboards and ad hoc reports built from Jupyter notebooks. You can completely hide Python, SQL, or R code cells and focus on markdown cells, visualizations, and interactive widgets. Or you can share the full version of the Jupyter notebook – you decide what content to include!
Watch an overview of the Reporting features below:
5 steps for a stunning dashboard
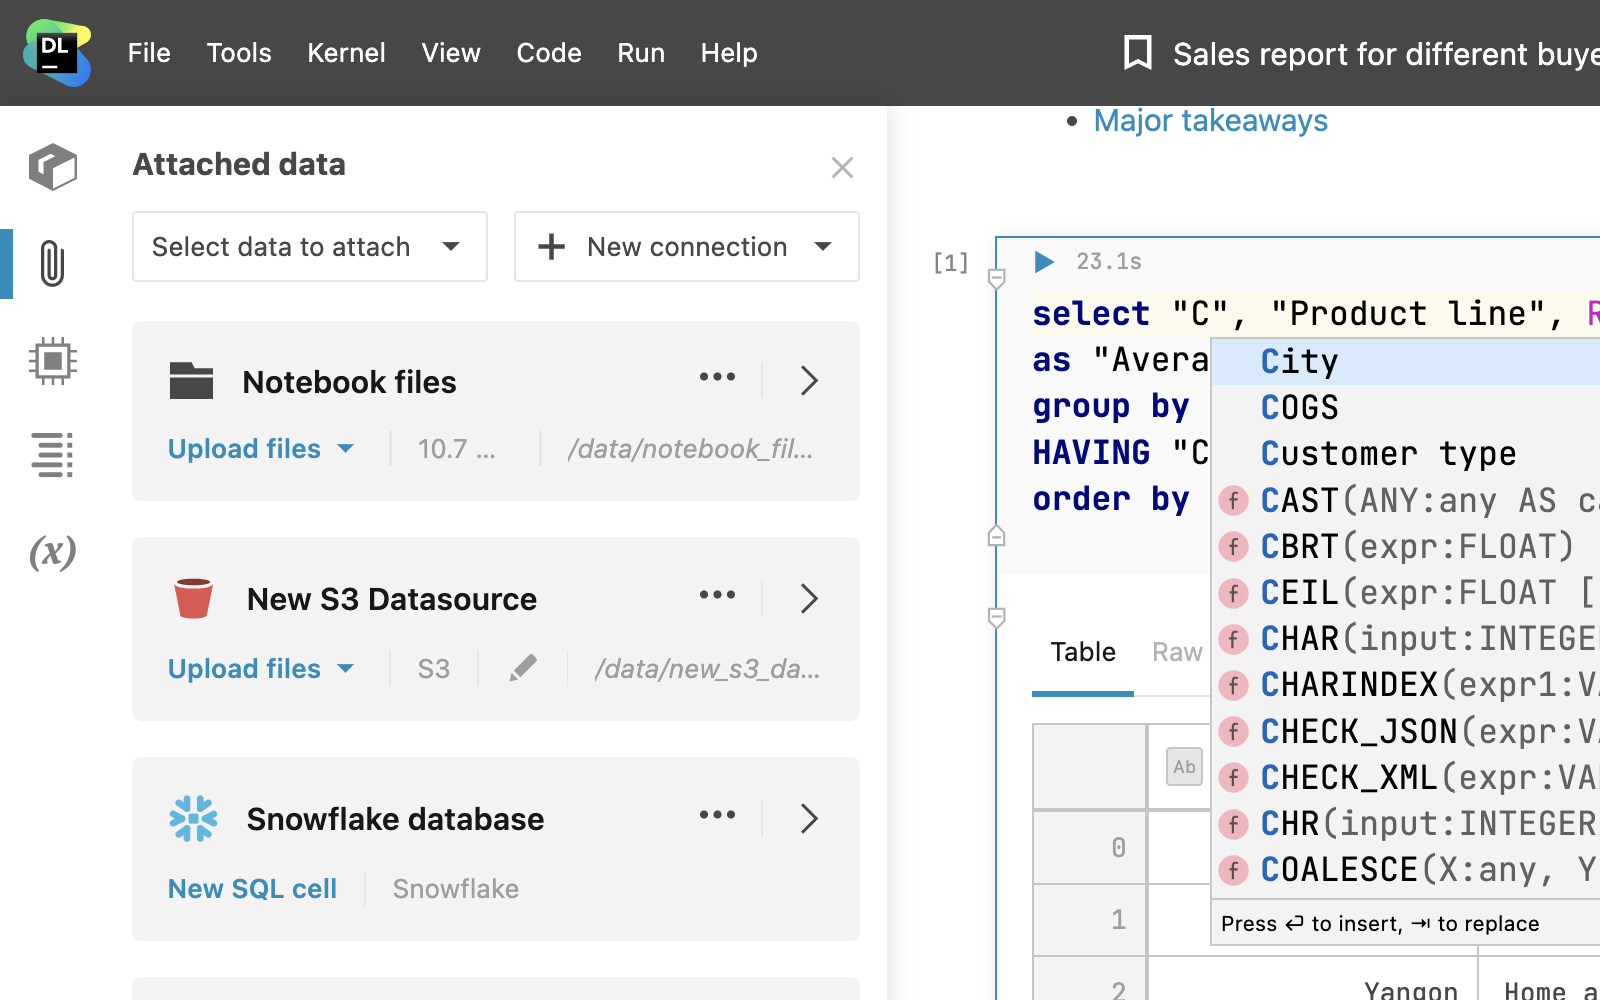
1. Pull the data for your dashboard
Access and query your data from SQL databases, S3 buckets, and CSV files in one notebook.
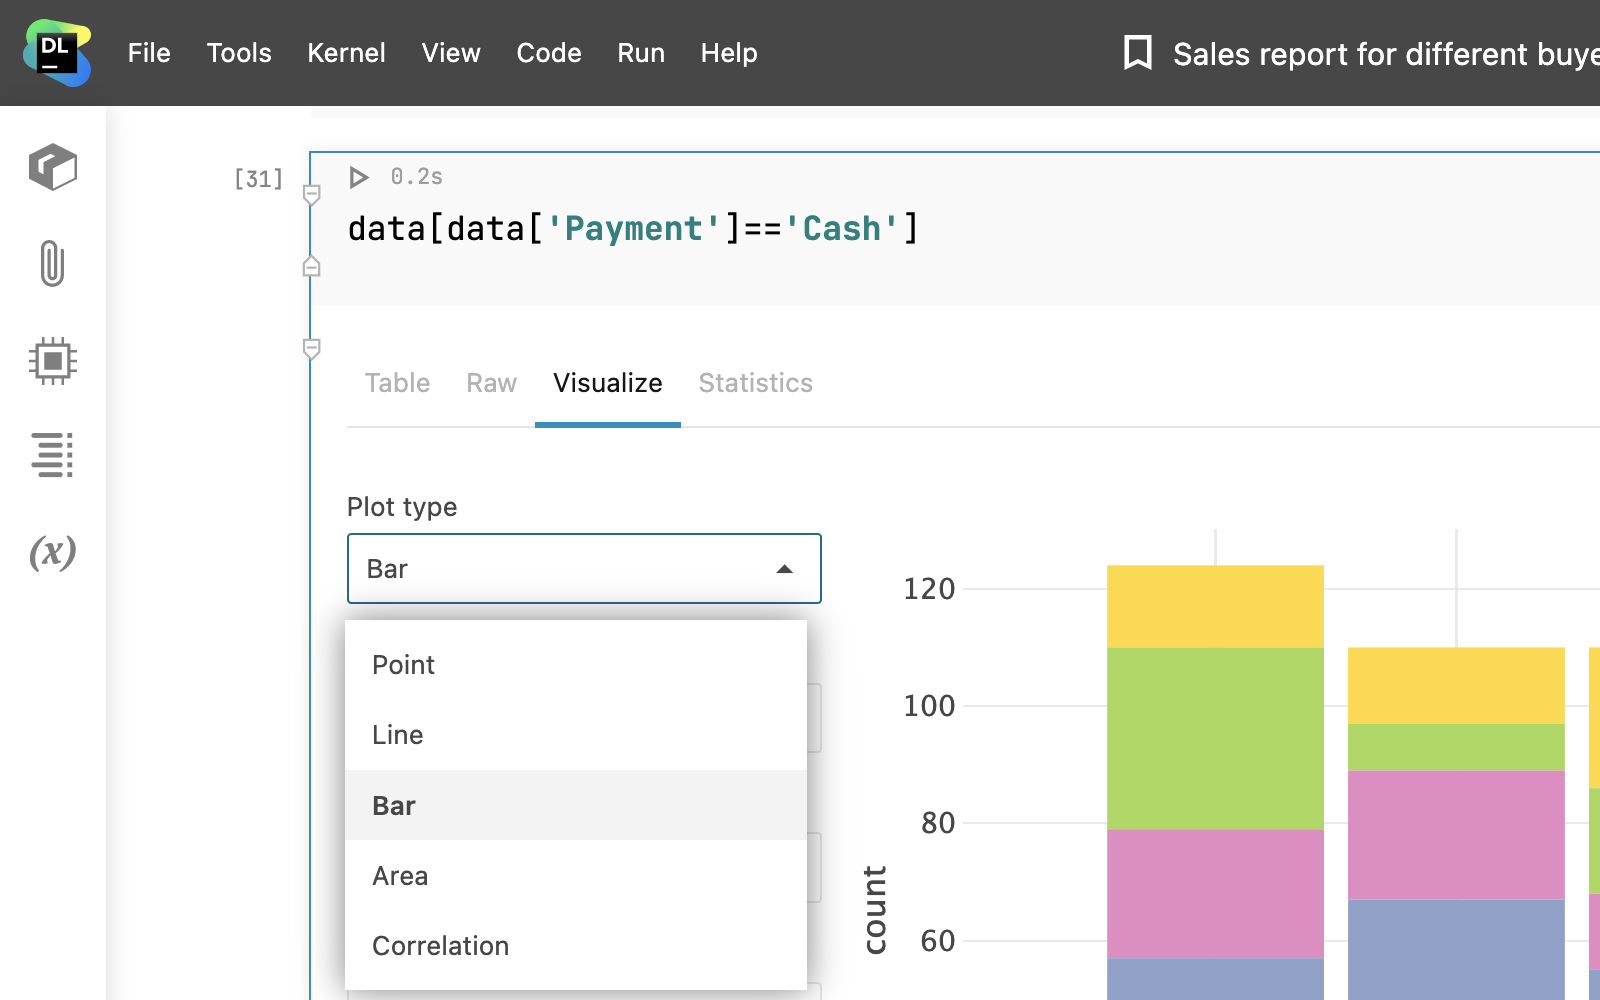
2. Analyze and visualize data
Get smart coding assistance for Python and SQL and use no-code automations for quick visualizations and data quality checks.
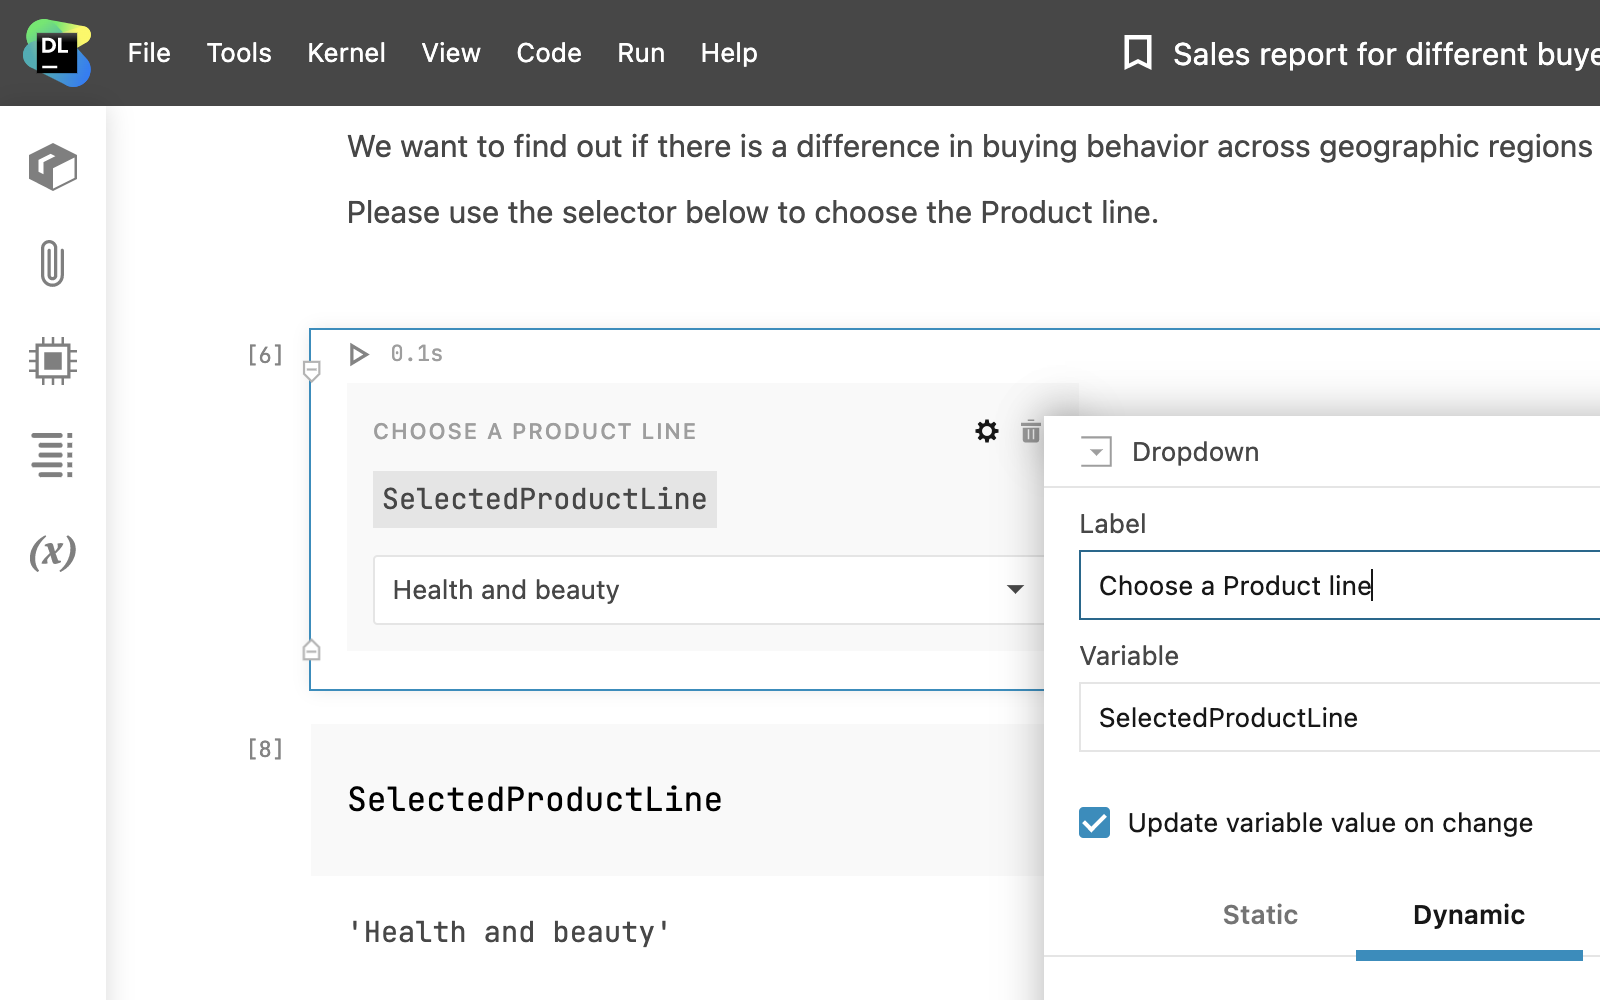
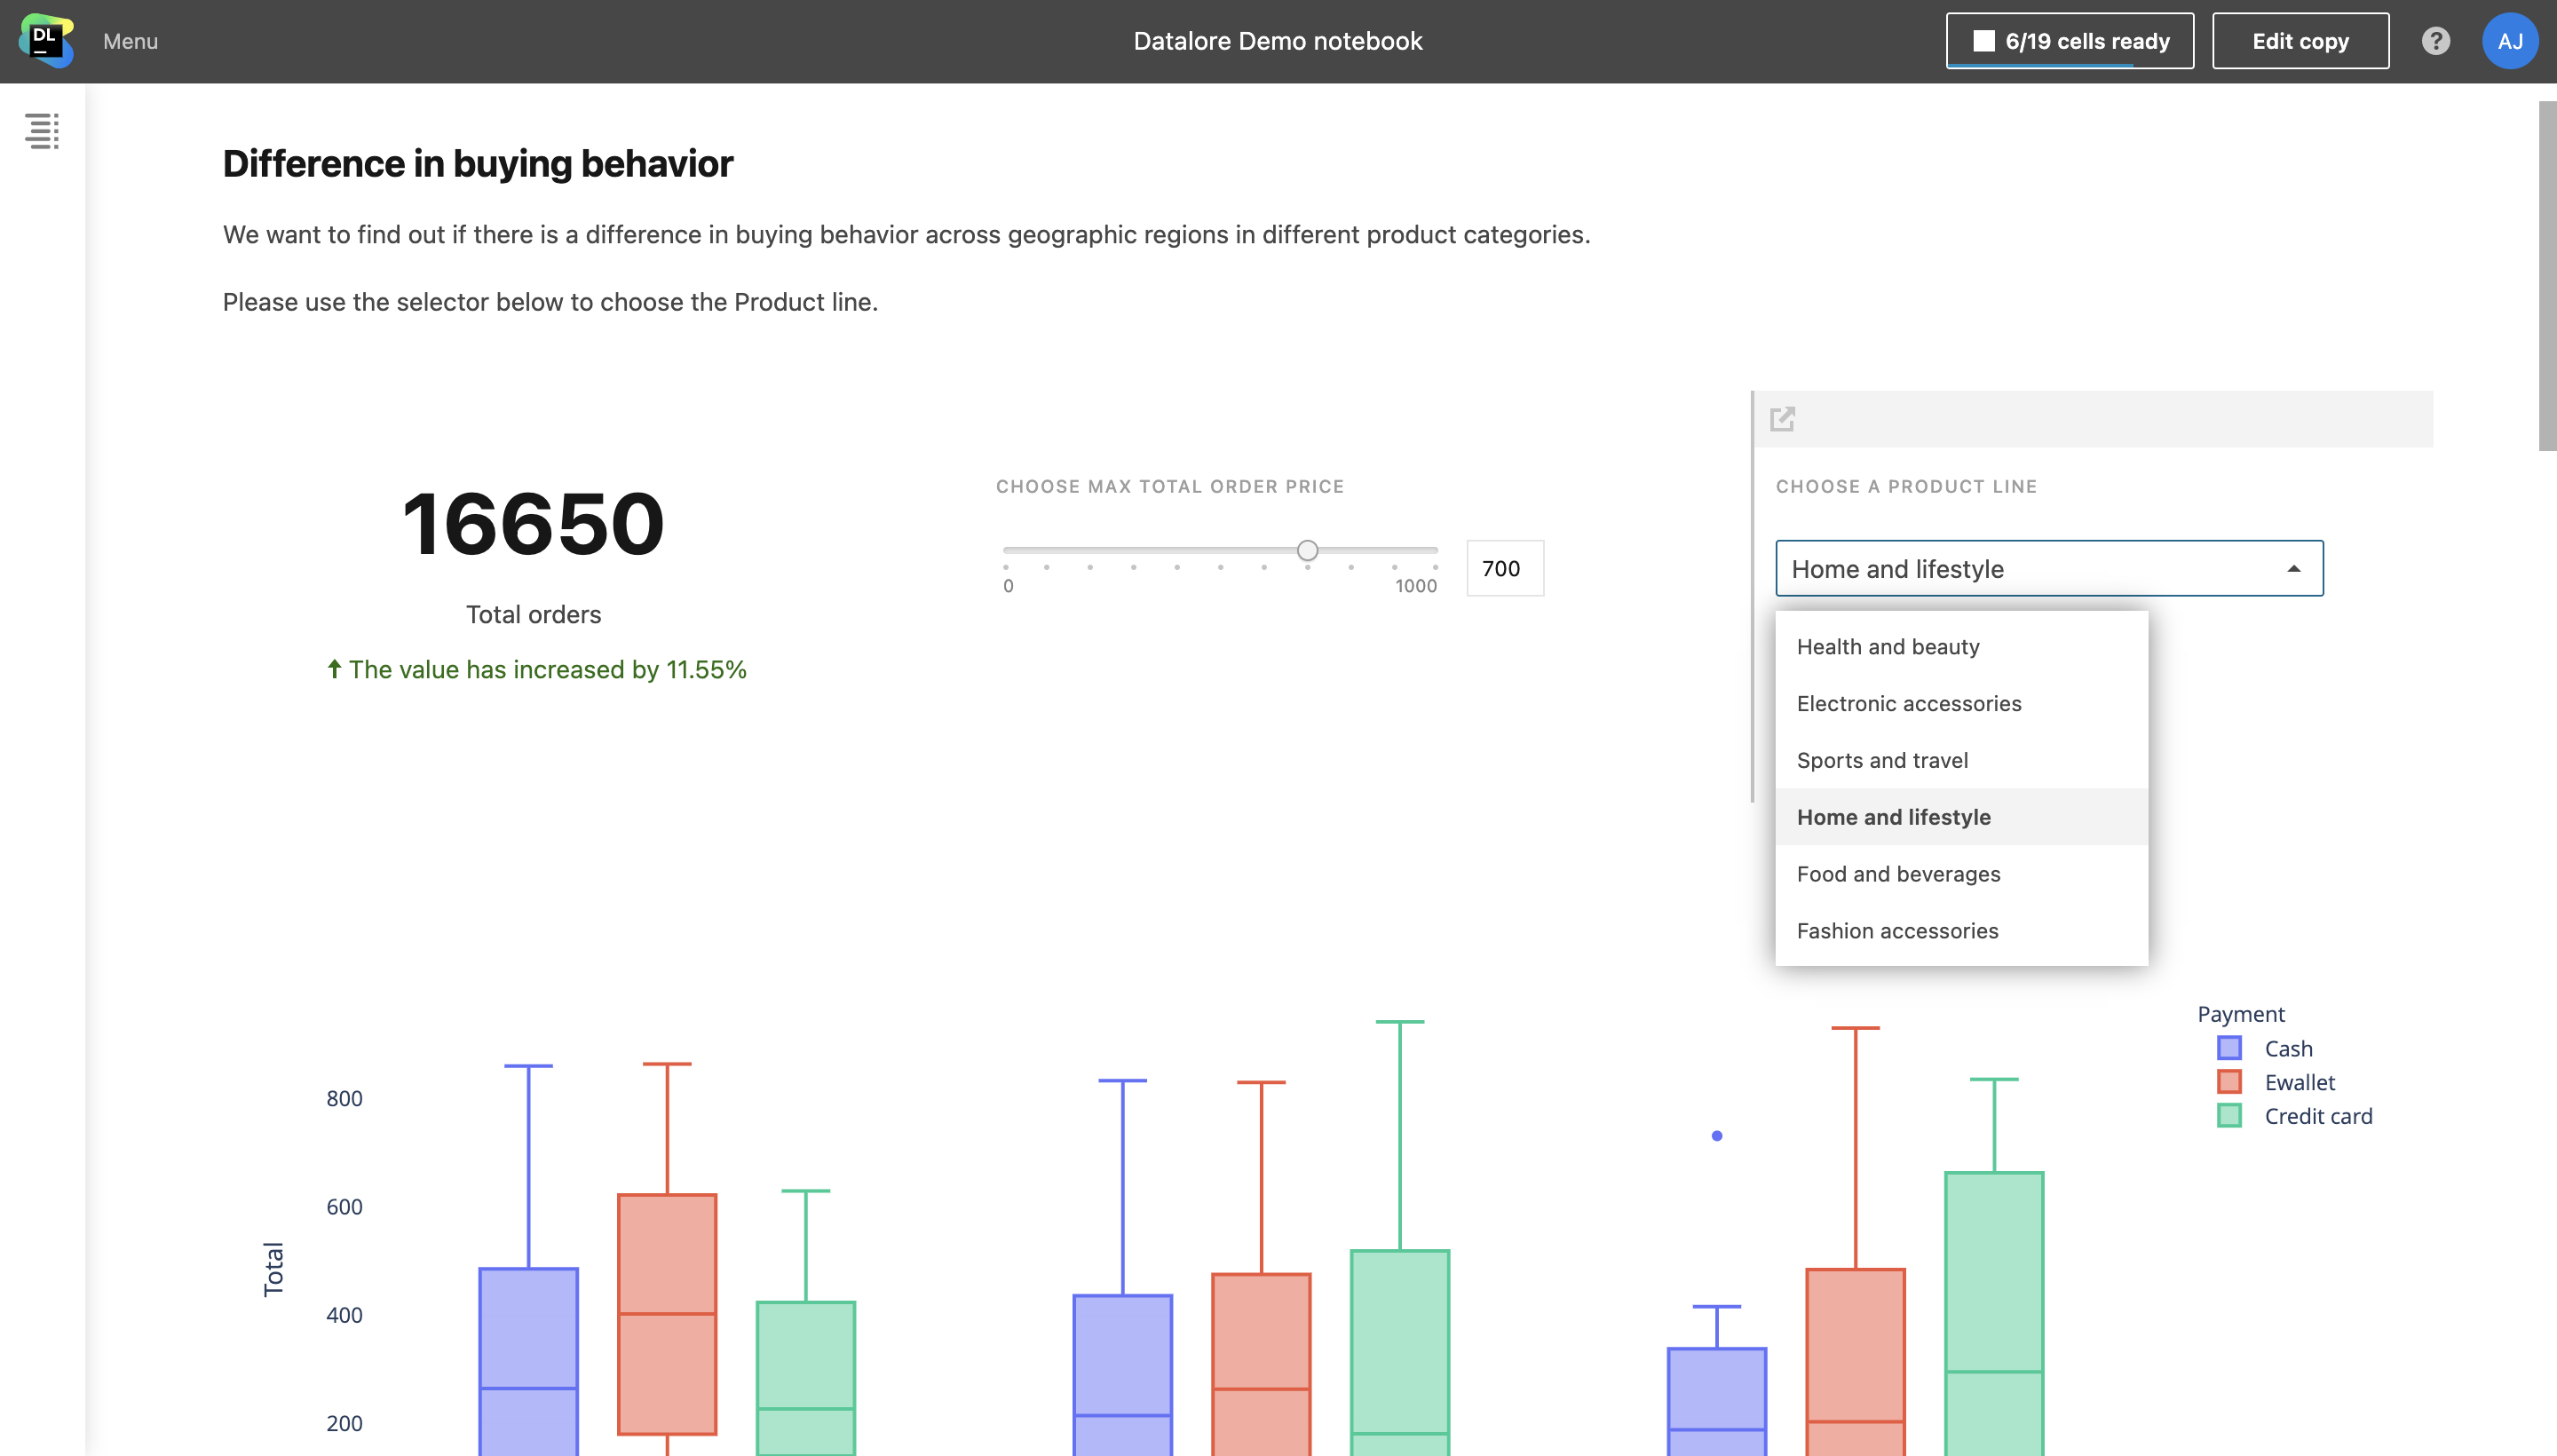
3. Add interactive controls
Add dropdowns, sliders, text inputs, and date cells inside your notebooks, and use the input values as variables inside your code.
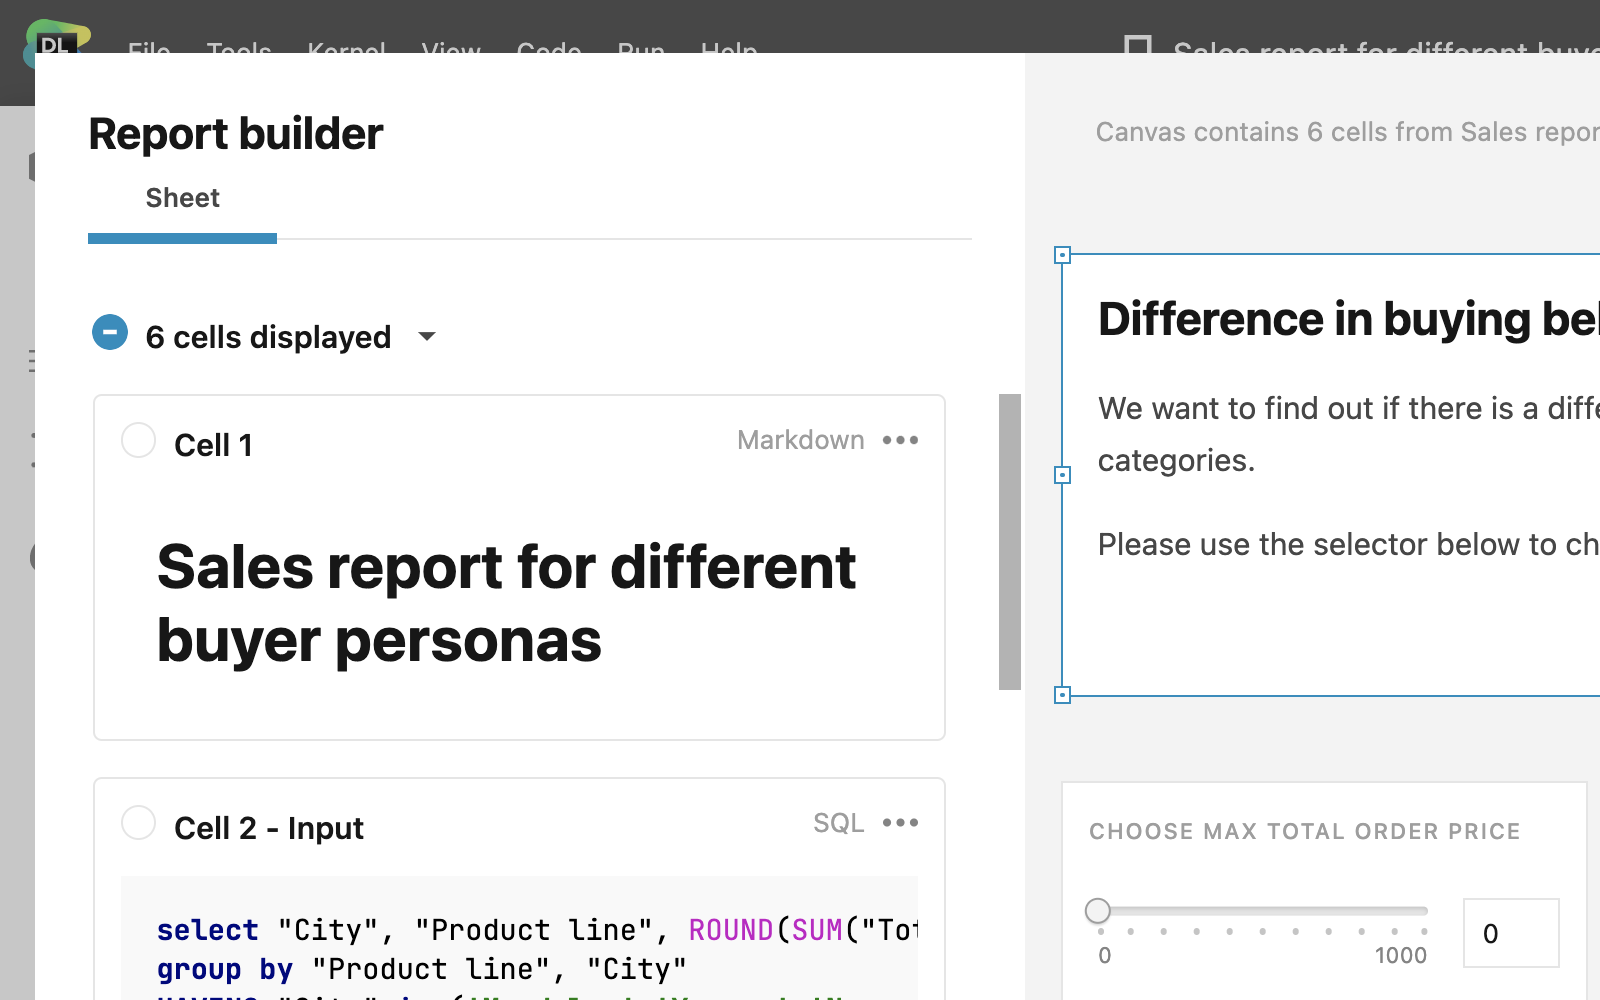
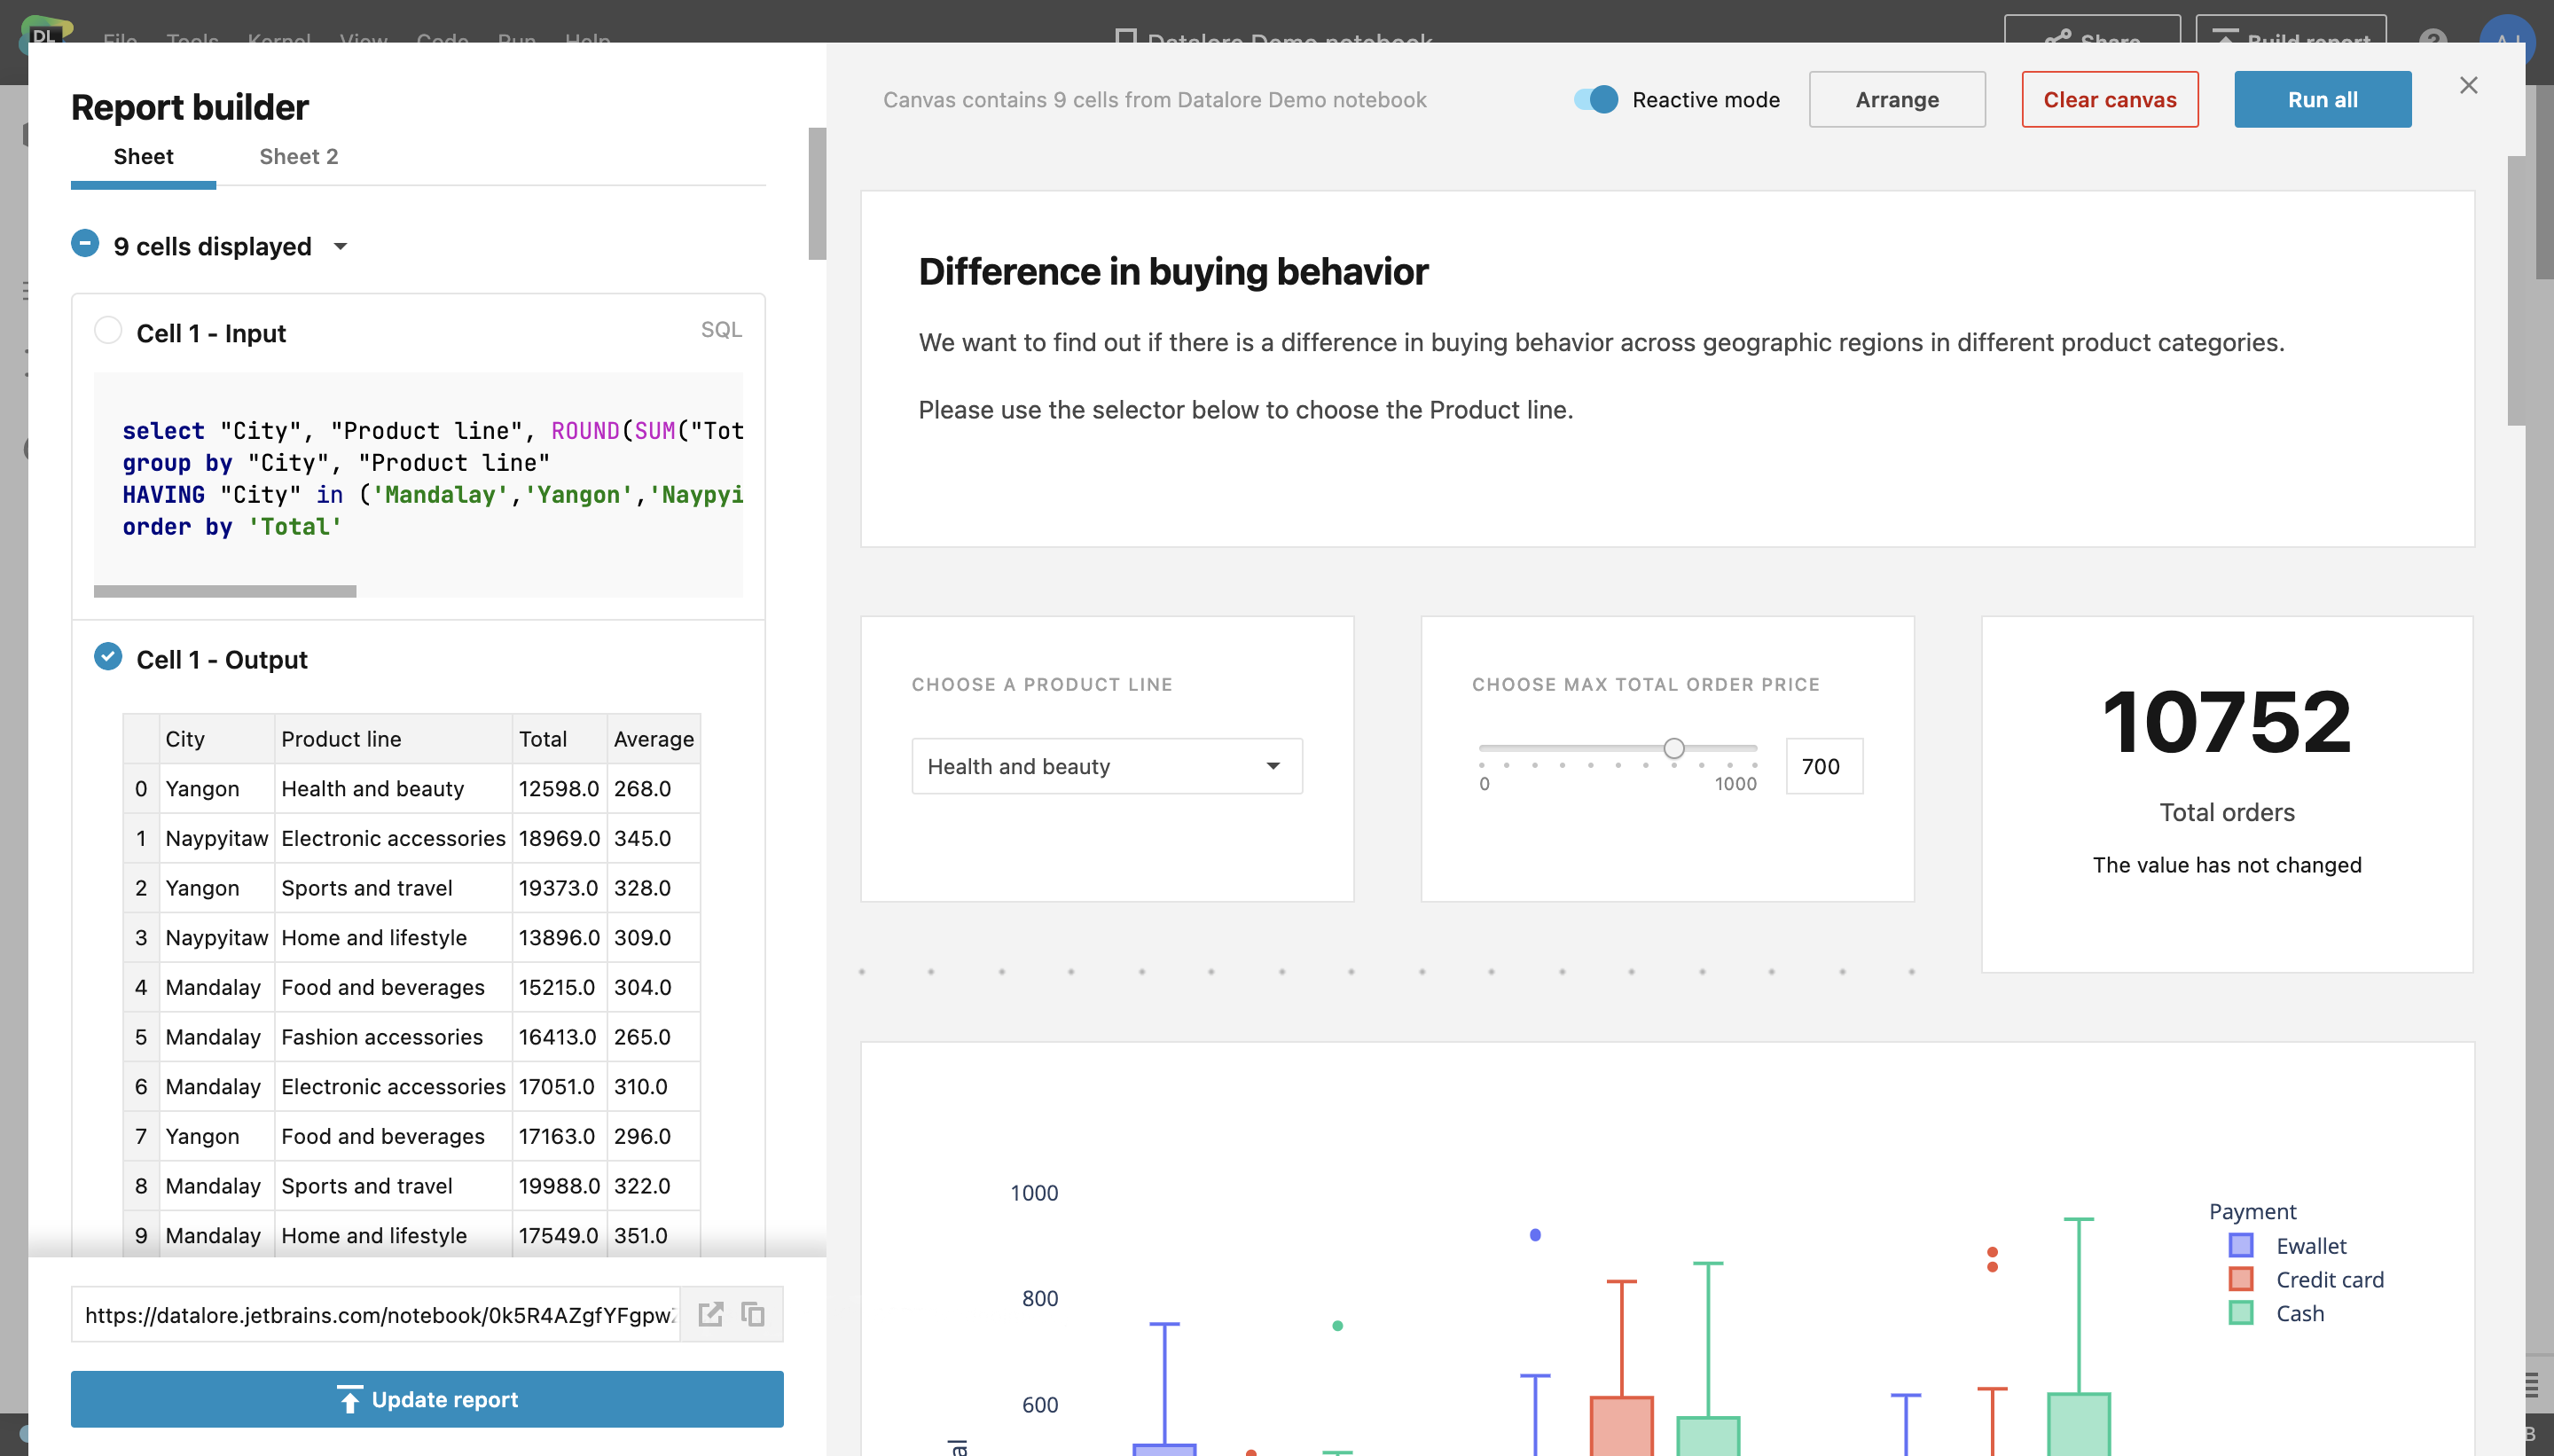
4. Build your report on a canvas
Arrange cells on the canvas, easily adjust their height and width, hide unnecessary steps, and share this as a static or interactive report.
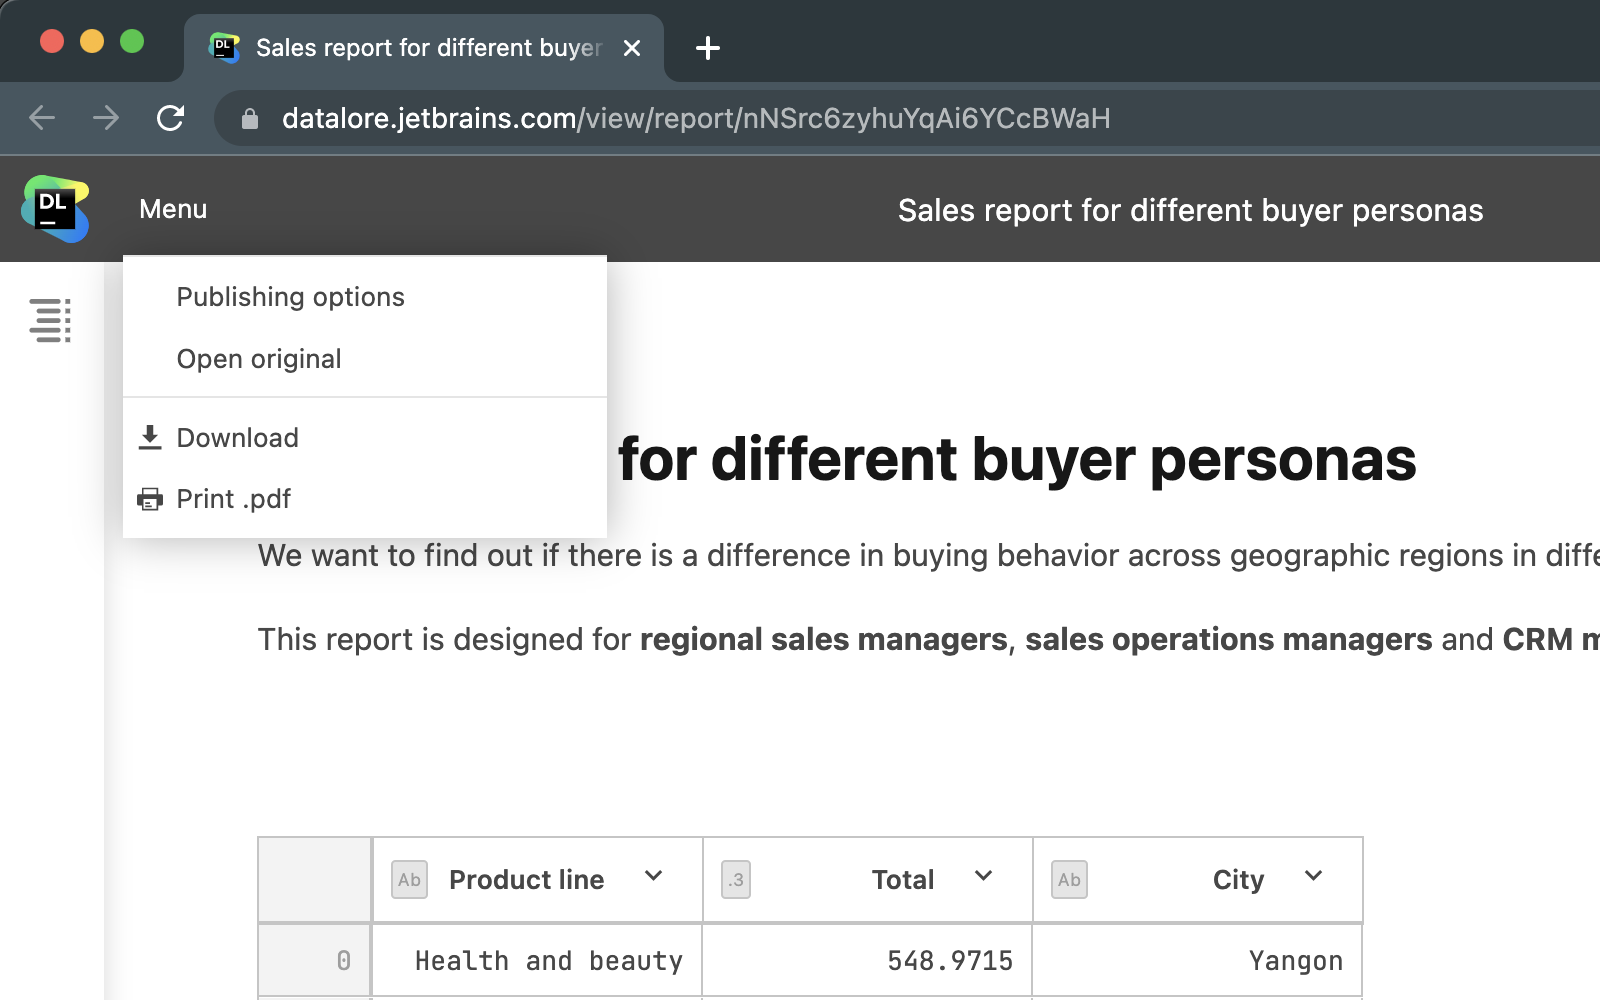
5. Share with stakeholders
Share interactive and static reports with unlimited recipients in your team with just a link.
Want to create a dashboard with Python and SQL?
Start using Datalore online for free, or install it privately for your team.
Datalore is a collaborative data science platform that streamlines insight delivery and helps data-driven teams be more productive.

Connect with us
Community forum
Blog
Twitter